Time domain features: Fisherwaves
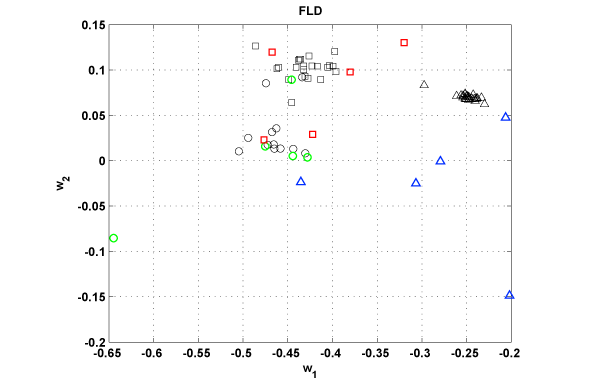
We also applied Multiple Discriminant Analysis to our data. Figure 1 shows the plot of the data projected onto the two eigenvectors. The train data seemed to be well separated. However, when we mapped new test data onto the eigenvectors, the result was poor (see figure 2). This implies the possibility of being over trained.
Figure 1 (green is motors, red is lamps, blue is electronics):
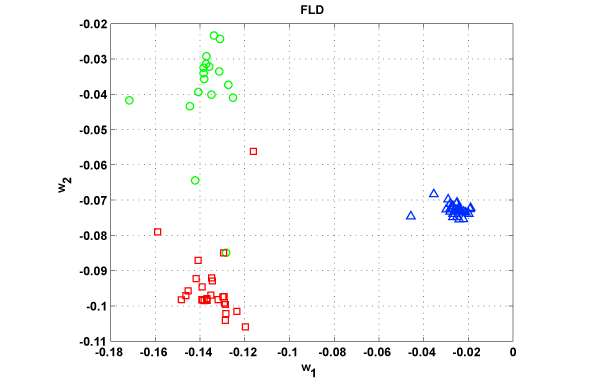
Figure 2 (black is training data, colored points are testing data, with green for motors, red for lamps, and blue for electronics):