Time domain features: Eigenwaves
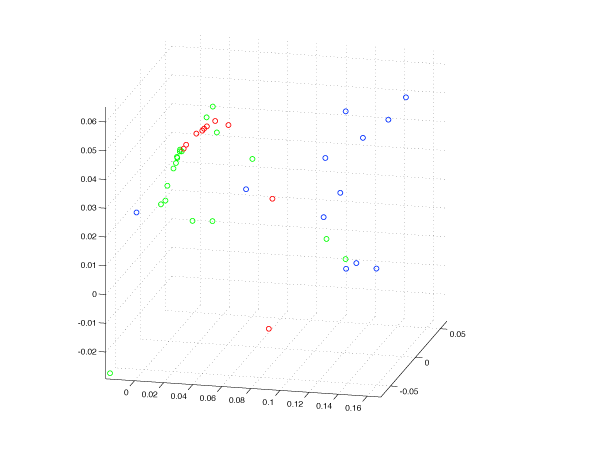
Applying PCA to our data, we got 133 eigenvectors where we chose the 3 eigenvectors with the highest eigenvalues. Figure 1 shows the 3d distribution of the data. The result is lower than the one illustrated by the figure in the previous page.
Figure 1 (green is motors, red is lamps, blue is electronics):